What the workbook contains
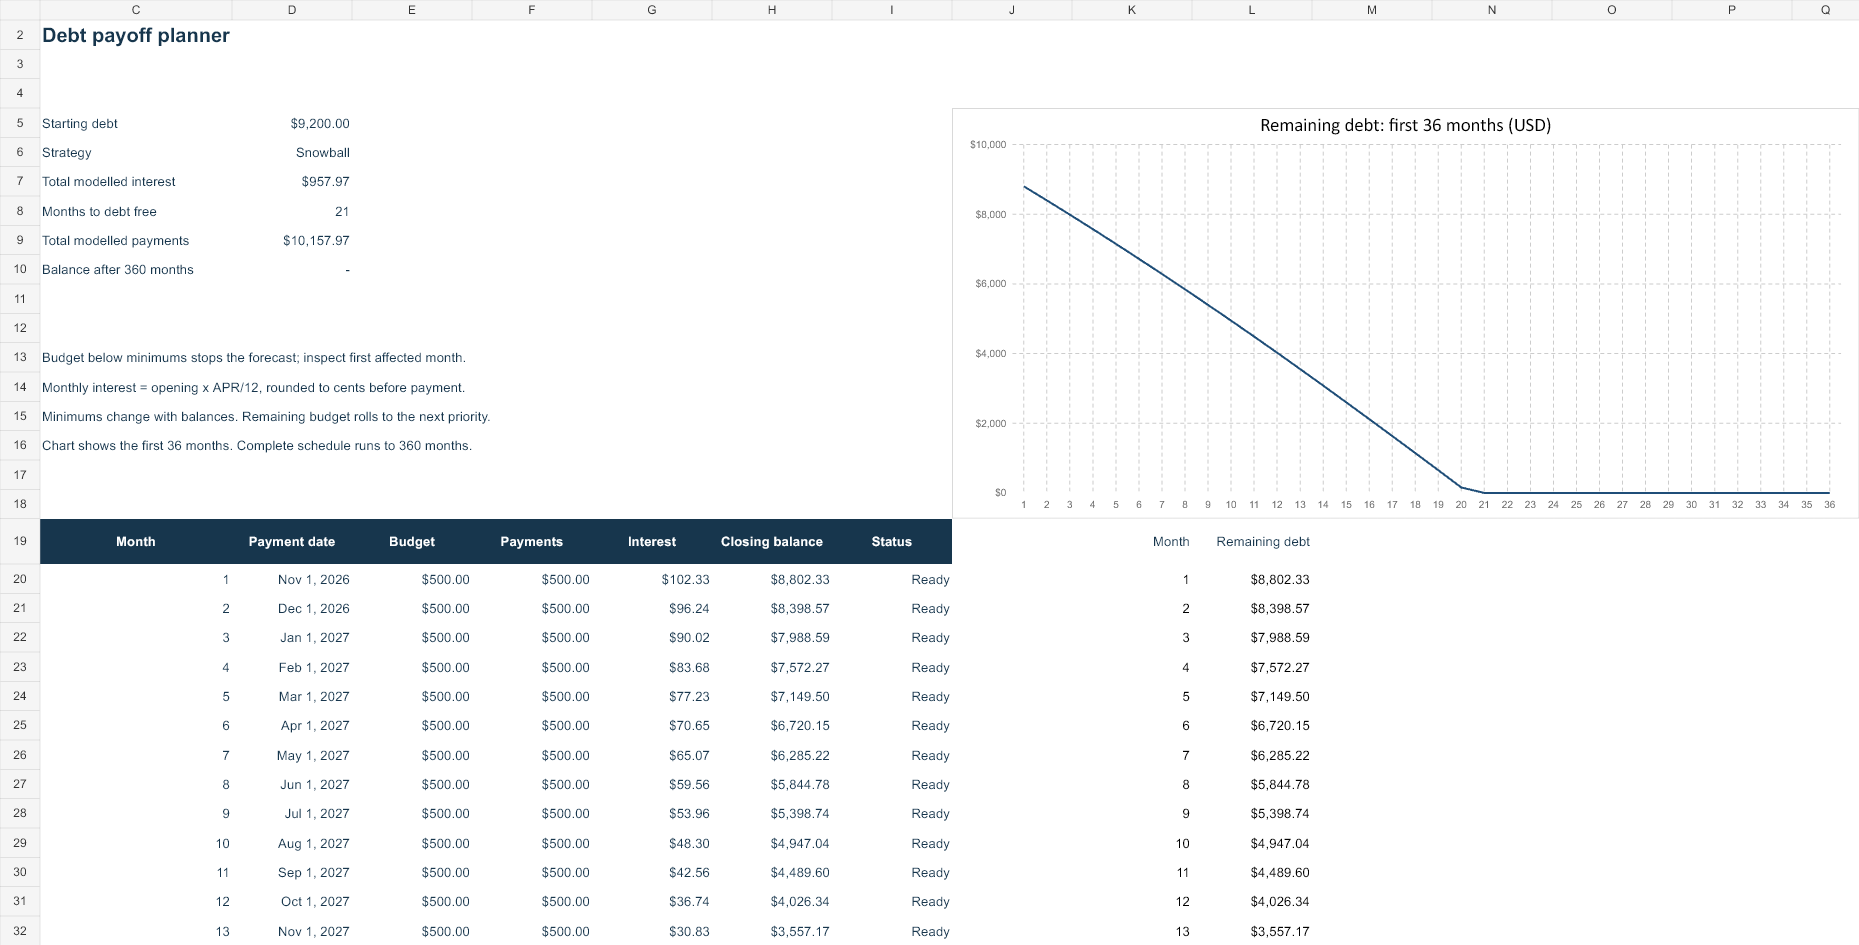
Summary shows opening debt, strategy, projected interest, months to debt free, total payments and the remaining balance after the 360-month horizon. Its monthly table links to the account allocation ledger. A native editable chart shows the first 36 months; the underlying ledger covers all 360 months.
Inputs contains one selector: 1 for snowball, 2 for avalanche. Enter a default monthly payment budget, first payment date and five account rows. Each account has a name, opening balance, annual rate, fixed minimum floor and percentage minimum share. Use zero for unused numeric inputs. Optional monthly budget overrides can increase or reduce available money for a particular month.
How the model allocates a payment
- Carry each prior closing balance into the next month.
- Calculate interest as opening balance times annual rate divided by twelve, rounded to cents.
- Calculate each generic minimum as the lower of total owed and the greater of the fixed floor or opening balance times minimum share plus interest.
- If the budget covers every minimum, pay those minimums and direct the remaining budget through the selected priority order.
- Cap each payment at its amount owed and pass any unused extra to the next active account in the same month.
Snowball sorts by current opening balance. Avalanche sorts by annual rate. Equal values use the original account row order. The model does not assume you borrow to cover a shortfall. If a budget is below the sum of minimums, the affected month and dependent future results become unavailable. The first affected month is visible in Summary.
Reproduce the example
The sample accounts are $1,200 at 24%, $3,000 at 18% and $5,000 at 8%. Fixed floors are $35, $60 and $150. The first two accounts have 2% minimum shares; the third has a zero share. First-month interest totals $102.33, required minimums total $303 and the extra pool is $197. Snowball allocates total payments of $245, $105 and $150.
With $500 available each month, the example reaches zero in month 21 and totals $957.97 interest. Changing rates or balances can change which strategy is cheaper. The single selector recalculates one build; it does not display a second live strategy forecast. Save separate dated working copies when comparing scenarios.
Model limits
This is a monthly illustration, not a credit-card statement engine. It excludes new borrowing, fees, daily interest, grace periods, promotional APR changes, debt settlement and contractual delinquency treatment. Creditor minimums can differ from the generic rule. A planned payoff date is conditional on every entered payment and assumption.
Open, edit and save
Open the XLSX in desktop Excel and save a working copy before changing blue inputs. Native Excel recalculation, representative input changes and save/reopen are checked before publication. Google Sheets can import XLSX through File → Import → Upload, but native Sheets rendering and calculation have not been verified. Review formulas, date handling and charts after conversion.
Your edited workbook stays on your device or the storage service you choose. This page serves files and runs an optional local browser model. It does not connect to creditors, collect account identifiers or upload your financial records. Normal hosting can log page and file requests.
Sources and calculation basis
The CFPB description of debt reduction strategies explains paying minimums across debts and directing extra money to a selected priority. Its explanation of credit-card interest describes why real statements may use daily balances and different rates. These sources support the concepts. All workbook layouts, monthly model conventions and invented USD examples here are AllMarkets material.