What this profit and loss template contains
The worksheet covers January through December 2026 as an illustrative reporting year, with an Annual column beside the monthly detail. The dates are period labels, not a claim that the invented numbers are historical results. Replace the inputs and period labels consistently for your reporting year.
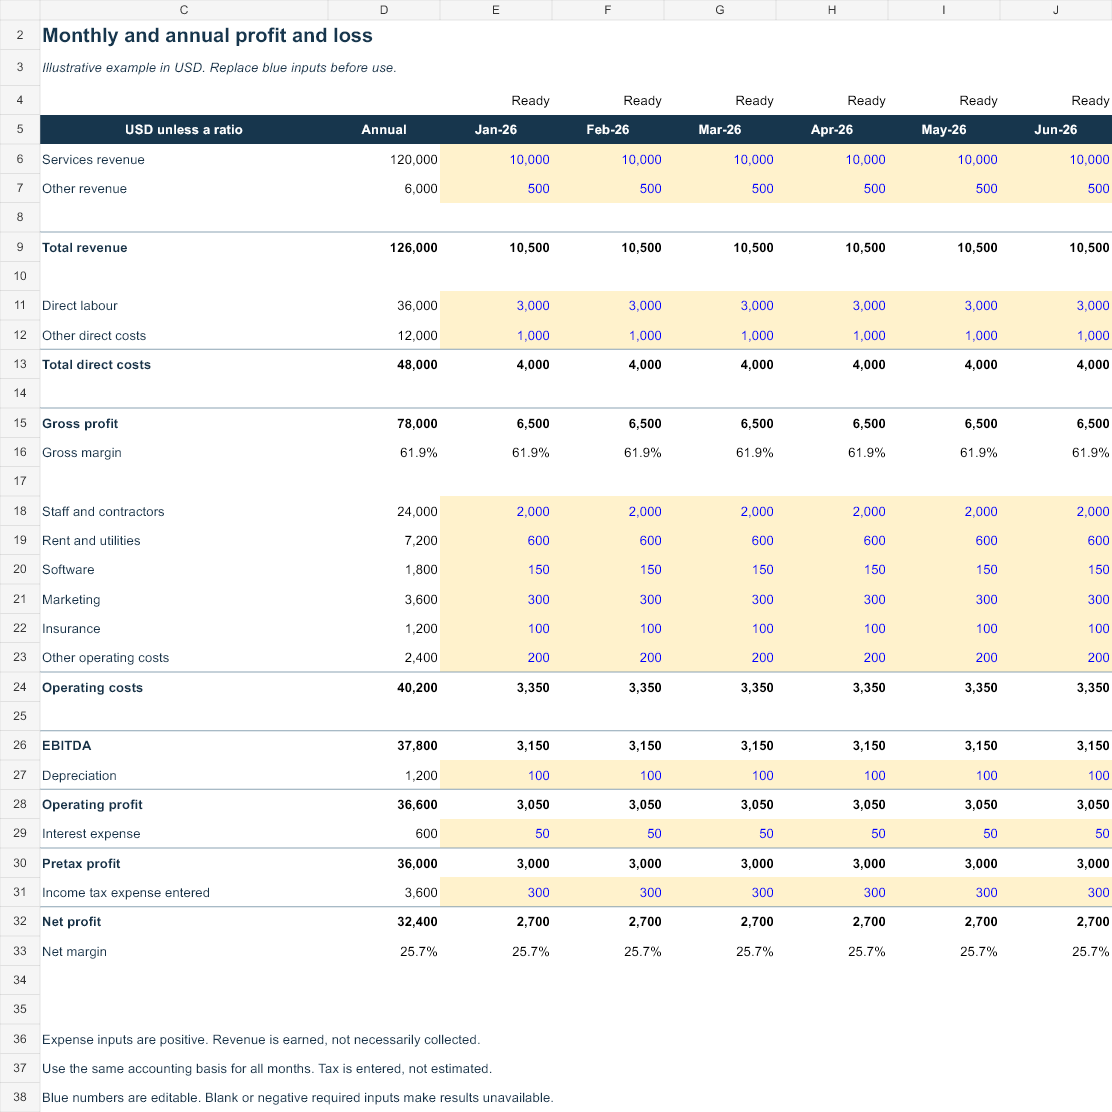
Revenue less direct costs produces gross profit. Operating costs are then deducted to show EBITDA. Depreciation produces operating profit, interest produces pretax profit, and the separately entered income tax expense produces net profit. EBITDA is simply the displayed intermediate subtotal in this model; it is not operating cash flow.
Editable inputs and calculation cells
Blue numbers on pale yellow backgrounds are editable monthly inputs. They include services and other revenue, two direct-cost categories, six operating-cost categories, depreciation, interest and income tax expense. Enter expenses as positive amounts. The black formula cells calculate the subtotals. Keep the same recognition basis across every category and month.
A blank required input is different from zero. Enter 0 when no cost occurred. Clear a required input and the affected month and annual calculation show n.a. rather than quietly omitting that month. Negative inputs are outside this simple P&L layout; use an accounting system when you need credit notes, reversals or more detailed contra accounts.
Reproduce the illustrative result
Each sample month contains $10,500 revenue and $4,000 direct costs, producing $6,500 gross profit. Operating costs total $3,350, leaving $3,150 EBITDA. After $100 depreciation, $50 interest and $300 entered tax expense, net profit is $2,700. With twelve identical months, annual net profit is $32,400.
Annual gross margin is annual gross profit divided by annual revenue. It is not the sum or simple average of the monthly percentages. A period with zero revenue has no defined margin and shows n.a.; the underlying profit or loss remains visible.
Use it for a real business
- Save an untouched copy of the downloaded example.
- Set a reporting year and map your accounts to the listed categories.
- Replace all twelve months of blue inputs, using zero deliberately where appropriate.
- Reconcile revenue and expense totals against your source ledger on the same accounting basis.
- Review unusual gross margins, losses and months marked Check inputs before using annual results.
What needs a separate schedule
Customer collections, supplier payment timing, debt principal, owner capital and capex purchases do not belong in profit merely because cash moved. Use the cash flow template for actual money in and out. This P&L does not determine tax rates, calculate deferred tax, prepare statutory financial statements or replace transaction-level bookkeeping.
Opening and saving the file
Open the downloaded XLSX in desktop Excel and save a copy before editing blue input cells. Formulas, representative input changes and save/reopen were tested in Microsoft Excel. Google Sheets can import XLSX through File → Import → Upload, but native Sheets rendering and recalculation have not been verified. Check formulas and charts after any conversion.
Keep financial records on a device and account appropriate for your business. This website serves the template; it does not receive your edited workbook or connect to a bank.
Definitions and further reading
The SEC introductory guide to financial statements explains why position, earnings and cash describe different financial information. The SBA business-management resources provide broader small-business context. These sources support the definitions; the original workbook layouts and invented examples are AllMarkets material.
Full methodology and limitations · Compare all four templates