 Open the full-size preview
 Open the full-size preview
 Open the full-size preview
Compare two distinct properties
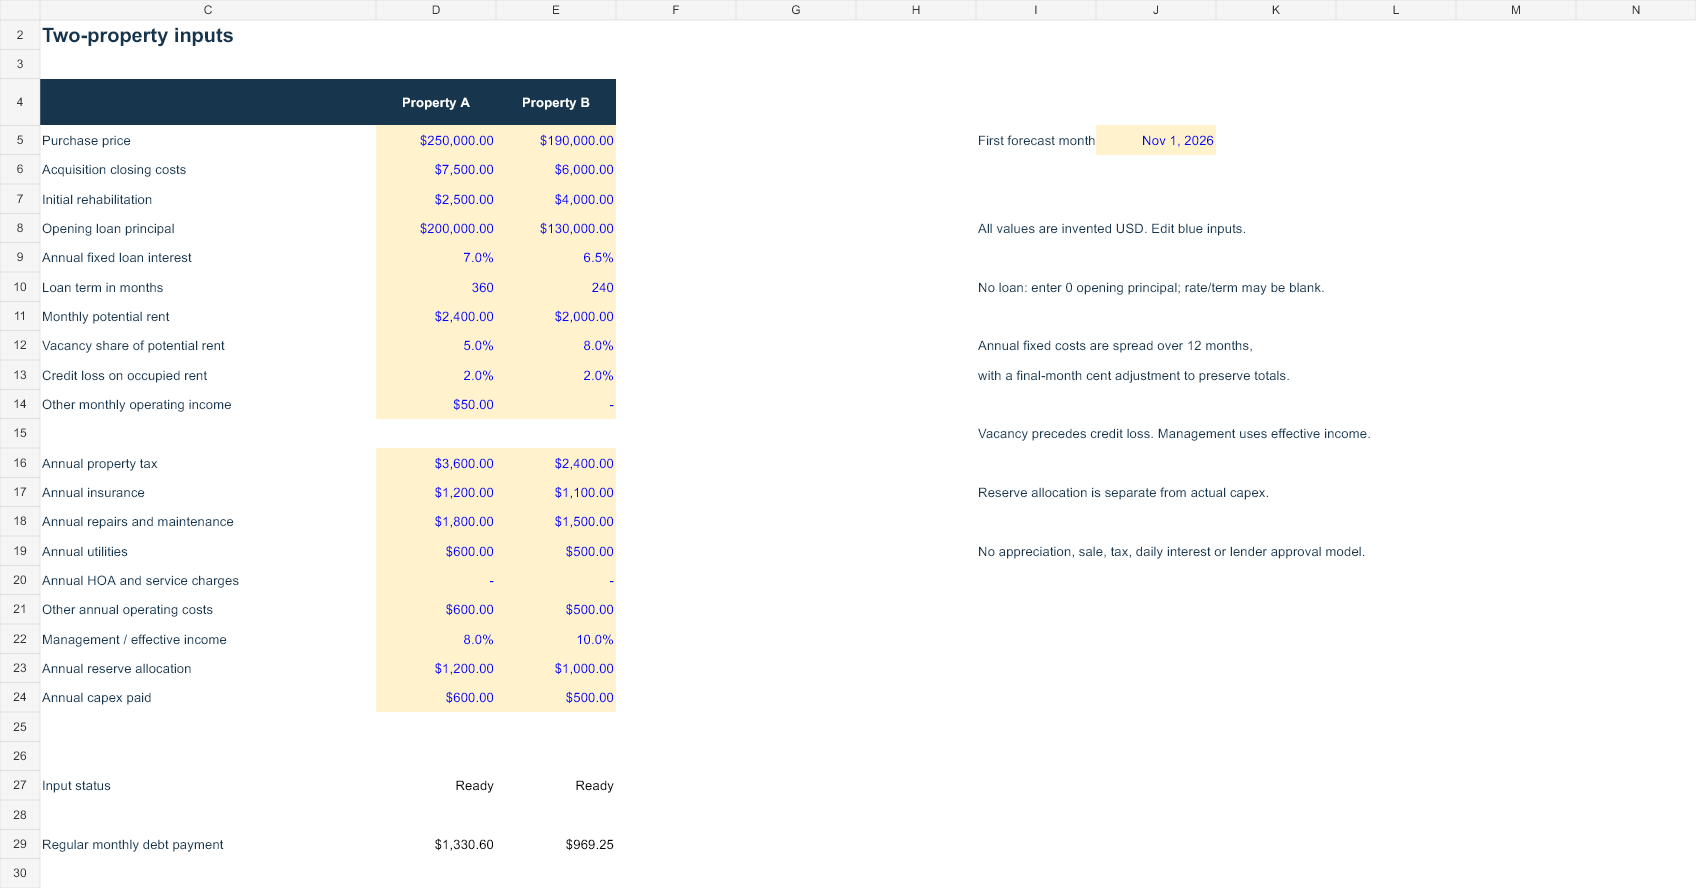
Inputs contains acquisition price, closing costs, initial rehabilitation, loan amount, fixed annual rate and loan term for each property. It also contains monthly potential rent, vacancy, credit loss, other income, annual operating-cost assumptions, management share, reserve allocation and capex. Both assets use the same first forecast month and twelve-month calendar.
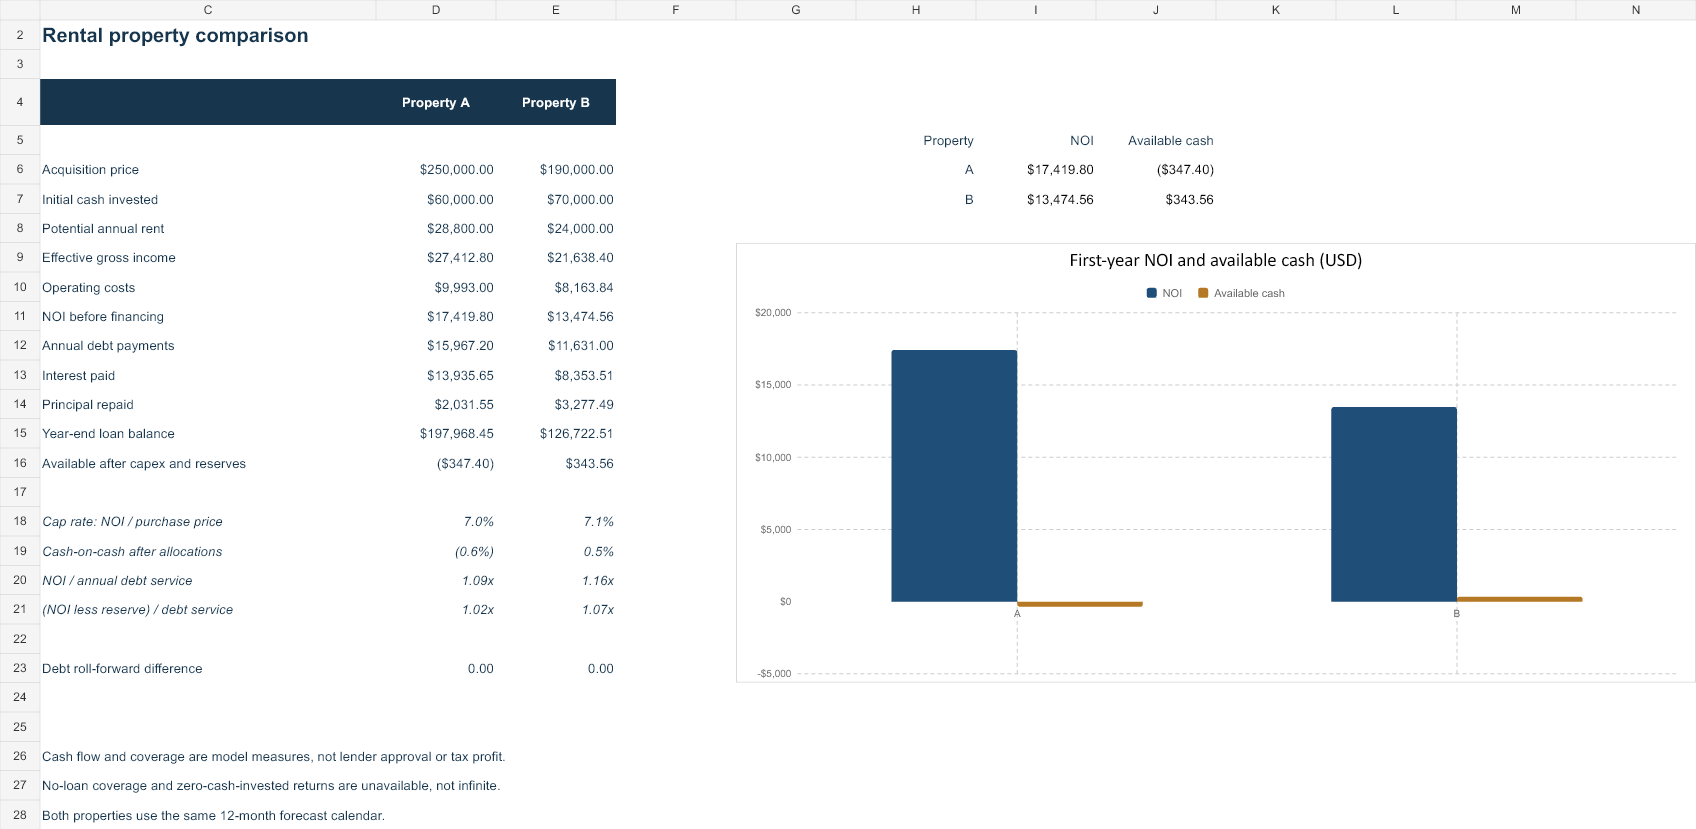
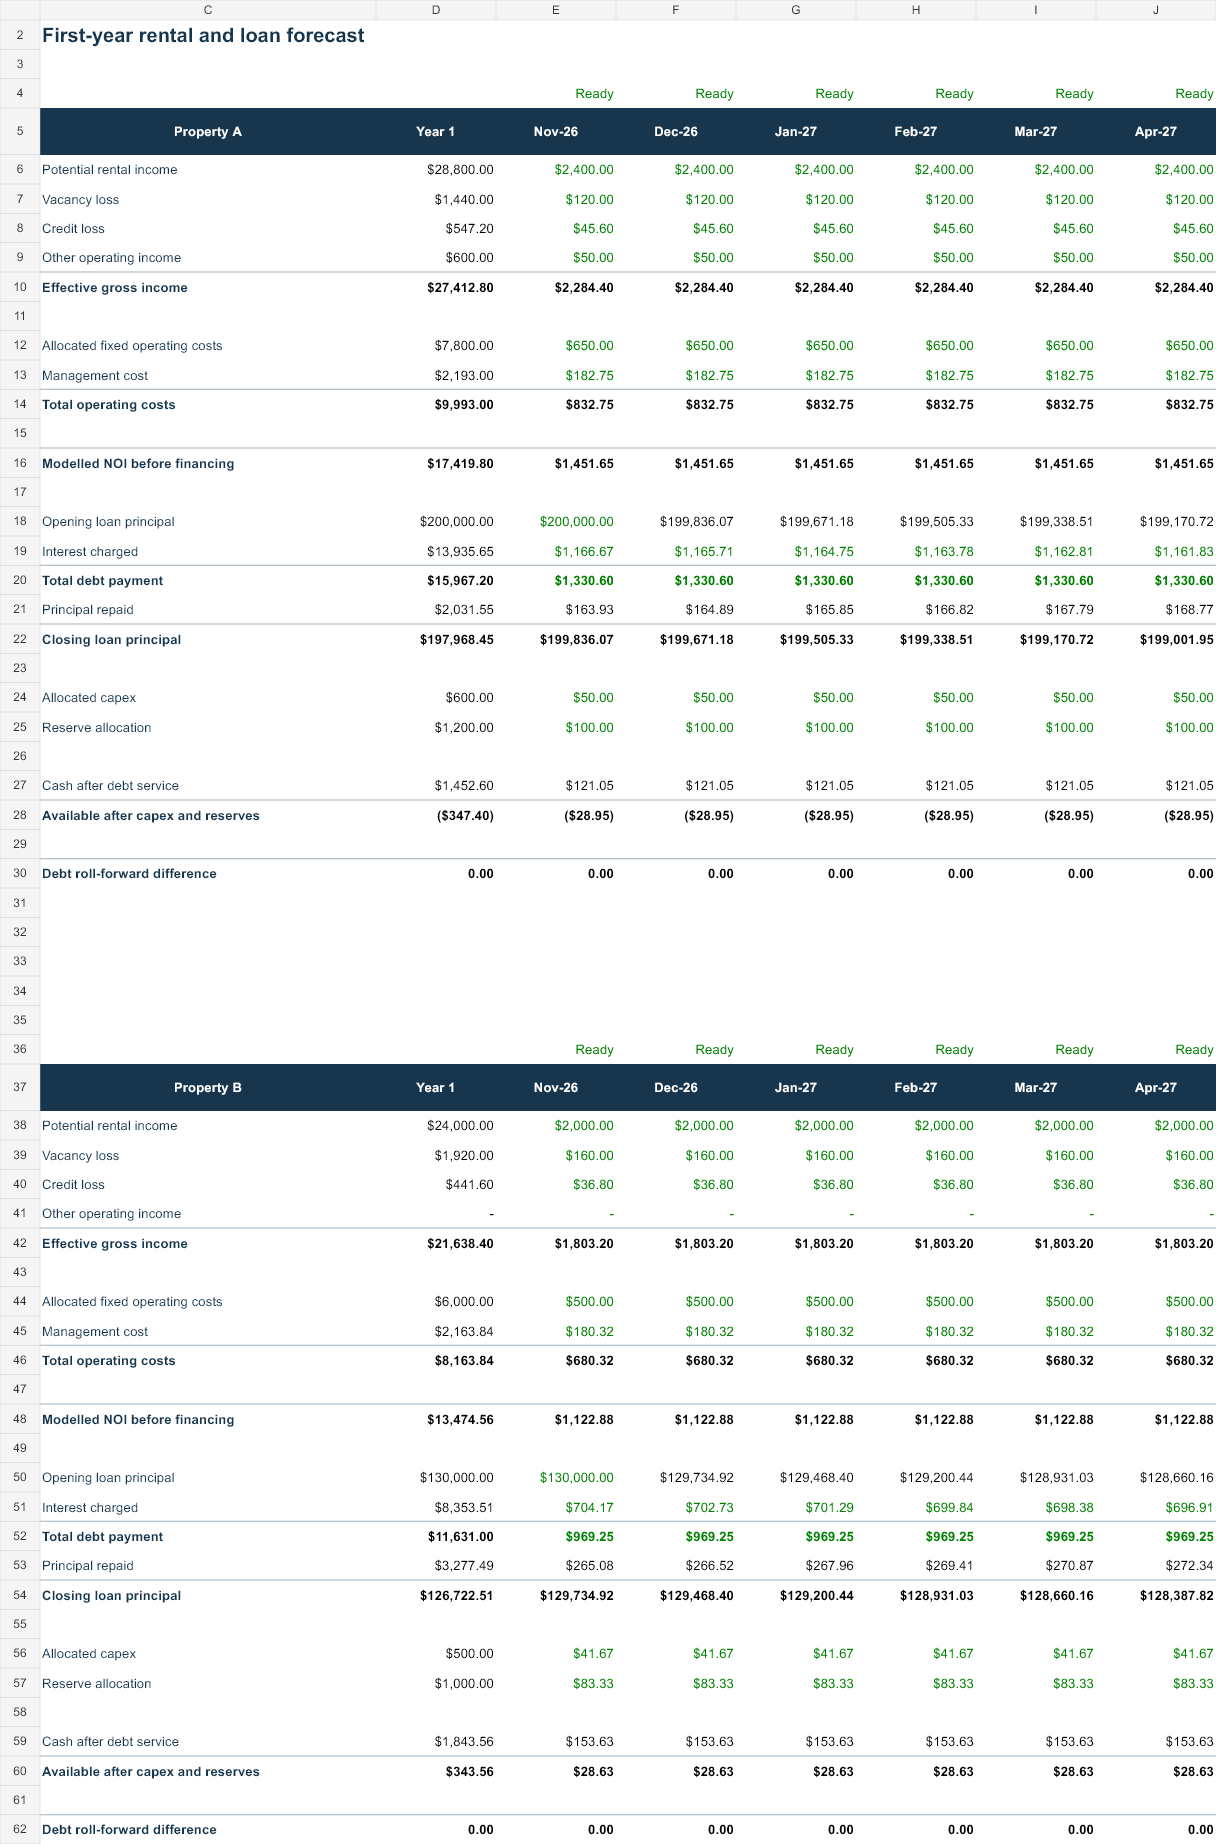
Year 1 calculates the two properties in separate blocks with visible monthly income, operating costs, loan interest, principal and closing debt. Comparison links those completed results into annual measures. The two columns represent distinct properties rather than a hidden pair of strategy forecasts.
Income and operating cost order
Vacancy loss is potential rent times the vacancy share, rounded to cents. Credit loss applies to potential rent after vacancy. Other monthly operating income is then added to produce effective gross income. Management cost is a share of effective income; entered annual fixed operating costs are allocated across the twelve months.
Annual costs, reserves and capex use eleven cent-rounded monthly allocations and a final-month adjustment so the annual total remains equal to the input. This is a planning allocation, not a claim about the actual payment dates of taxes, insurance or repairs. Use the actual cash record for real payment timing.
Debt and available cash
The regular payment uses a fixed-rate annuity formula, rounded to cents, with a zero-rate principal/term branch. Monthly interest is rounded on opening debt. The payment caps at debt plus interest and clears the remaining balance in the contractual final month. A loan that ends during year one has zero later interest and payments.
NOI excludes financing, capex and reserve allocation. Available cash subtracts debt payments, allocated capex and reserves. Initial cash invested is acquisition price plus closing and initial rehabilitation costs less opening loan principal. A loan above that combined acquisition cost is outside the model. An all-cash purchase can leave loan rate and term blank because those inactive assumptions are ignored.
Read the ratios carefully
Cap rate is modelled annual NOI divided by acquisition price. Cash-on-cash is available cash after capex and reserve allocations divided by initial cash invested. Both can be negative. A zero initial cash denominator produces n.a., not an infinite return.
The file separately shows NOI divided by annual debt service and NOI less reserve allocation divided by debt service. These are illustrative model ratios. Actual lenders may normalize income and costs, include reserves differently and apply their own contractual definitions. With no loan, debt coverage is unavailable rather than an approval signal.
Reproduce the invented comparison
Property A has a $250,000 purchase price, $60,000 initial cash invested and a $200,000 loan. It produces $17,419.80 annual modelled NOI and $15,967.20 debt payments. After $600 capex and $1,200 reserves, available cash is negative $347.40. Year-end debt is $197,968.45.
Property B has a $190,000 price, $70,000 initial cash invested and a $130,000 loan. Its annual NOI is $13,474.56, debt payments are $11,631 and available cash is $343.56 after $500 capex and $1,000 reserves. Year-end debt is $126,722.51. These assumptions do not include appreciation, sale costs, tax, refinancing, variable rates or daily interest.
Open, edit and save
Open the file in Microsoft Excel and save a dated working copy before replacing blue inputs. Native recalculation, representative input changes and save/reopen were tested in separate copies. Google Sheets can import XLSX through File → Import → Upload, but native Sheets layout and recalculation have not been verified. Review formulas, dates and charts after conversion.
Your edited records stay on your device or the storage service you choose. This site supplies a template and does not receive tenant names, lease files or account credentials. Normal hosting can log page and file requests. Use fictitious labels when experimenting with examples.
Sources and definition boundaries
Fannie Mae Form 4254.DEF distinguishes rental operating income, operating costs and reserve-related measures. Its underwriting and reporting conventions are more detailed than this original model. The IRS rental-income overview explains the distinction between rent and refundable deposits, among other tax topics. These files do not determine tax treatment, prepare a tax return or certify lender coverage. Layouts and all numerical examples are original AllMarkets material.
Read the full methods and verification · Compare all three workbooks